Airbnb Market Analysis

EDA
Airbnb
Exploring price, availability, and room type in Airbnb listings in New York.

This analysis examines trends in Airbnb data to uncover insights about pricing and room types.

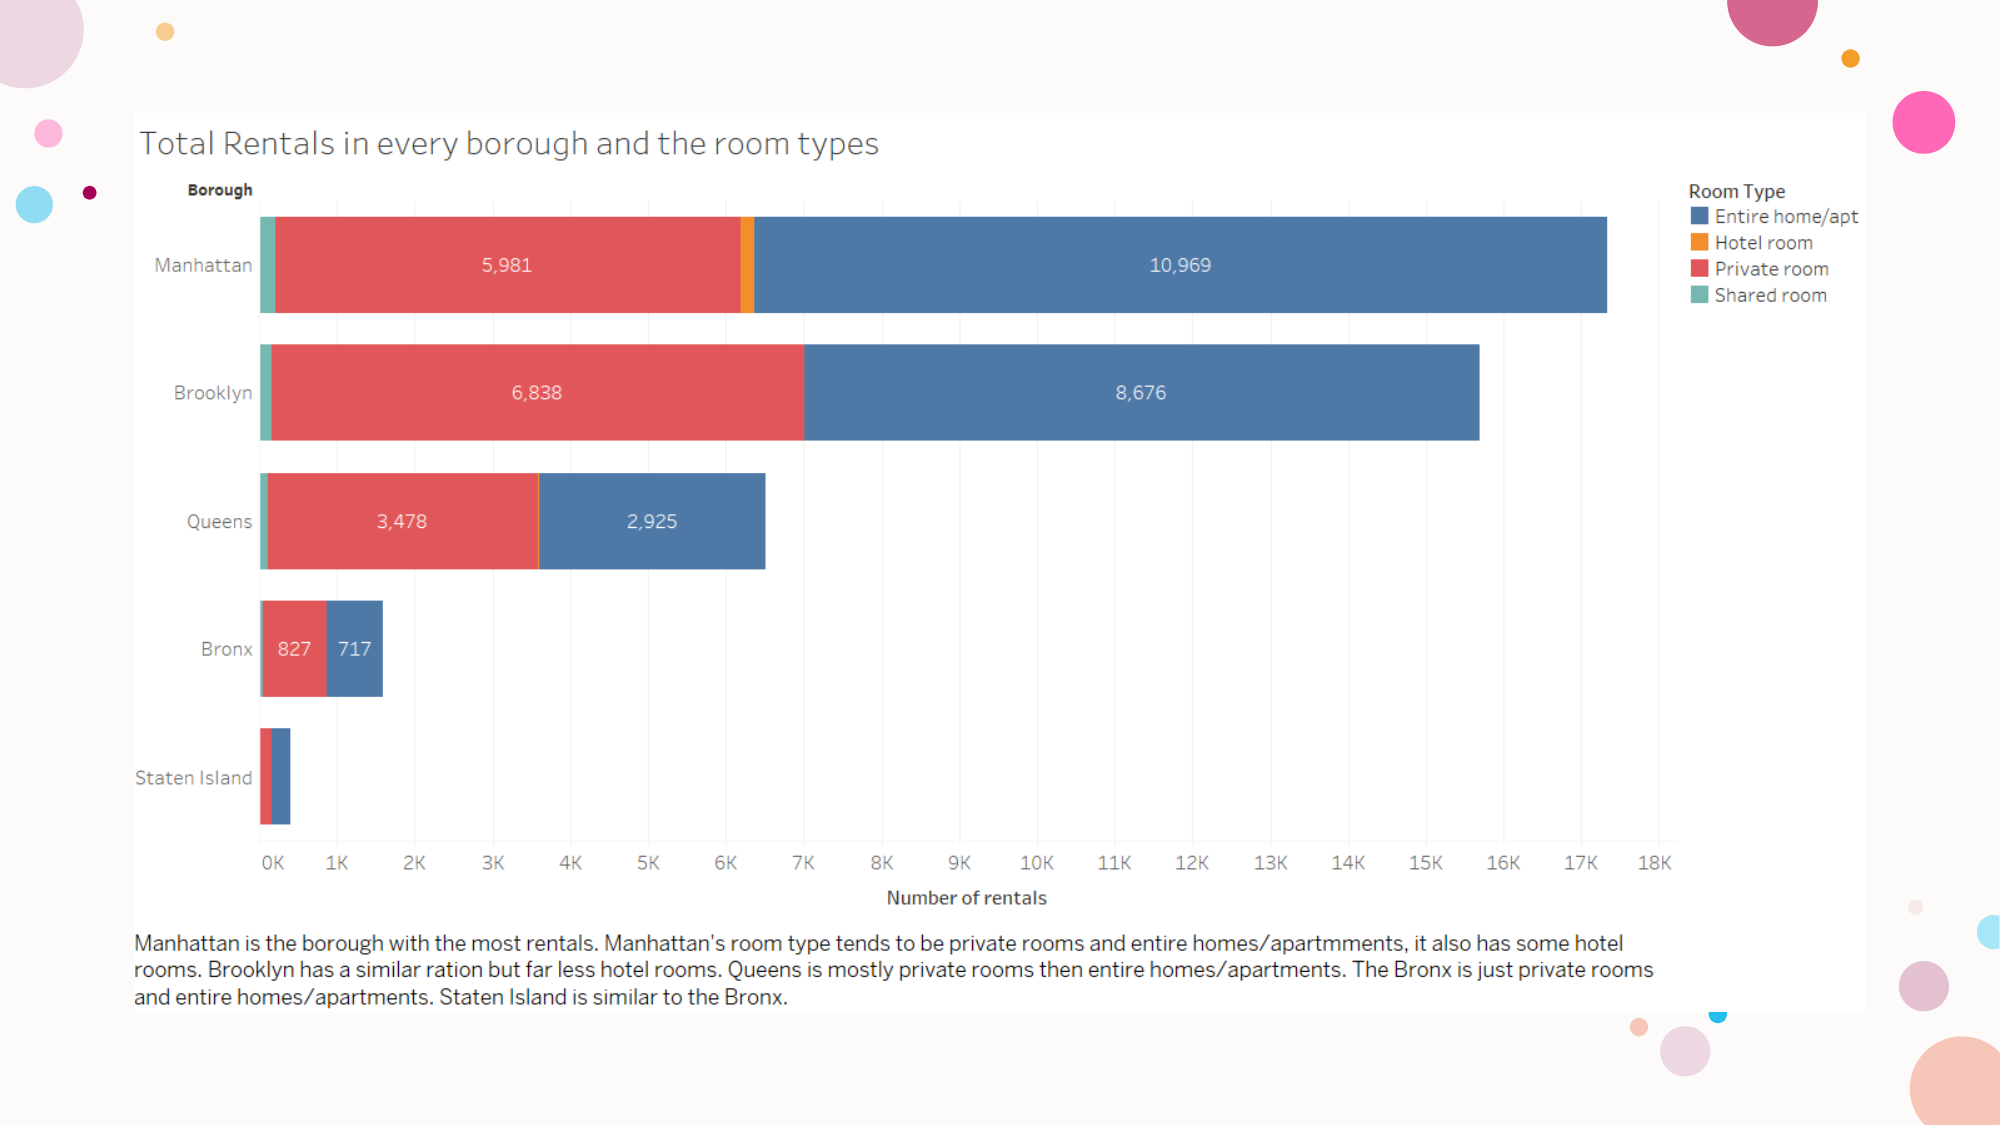
Rentals by Borough & Room Type

Distribution of total rentals across NYC boroughs, broken down by room type. Manhattan dominates, with a mix of private rooms and entire homes.

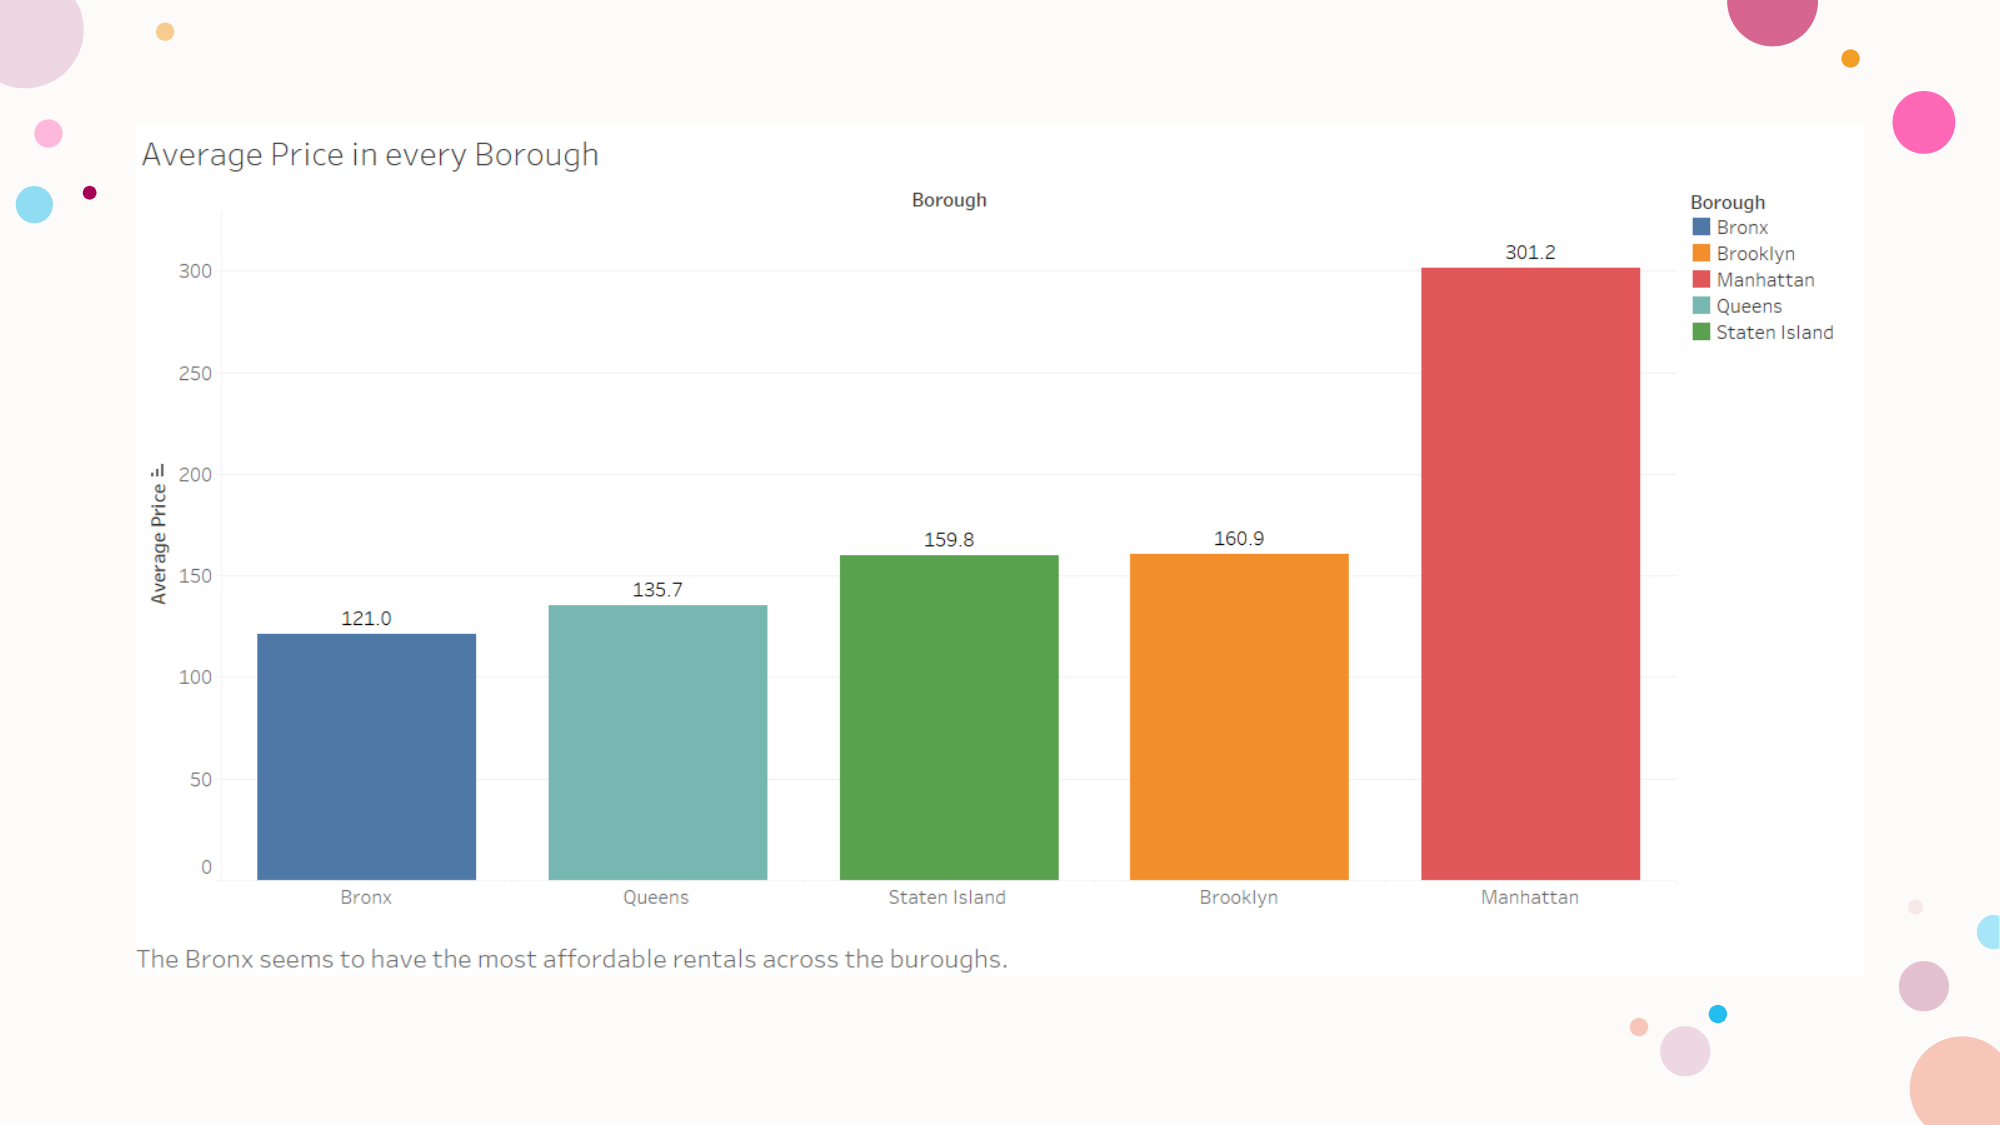
Average Price by Borough

Comparison of average nightly prices across boroughs. Manhattan is the most expensive by far, while the Bronx offers the most affordable stays.

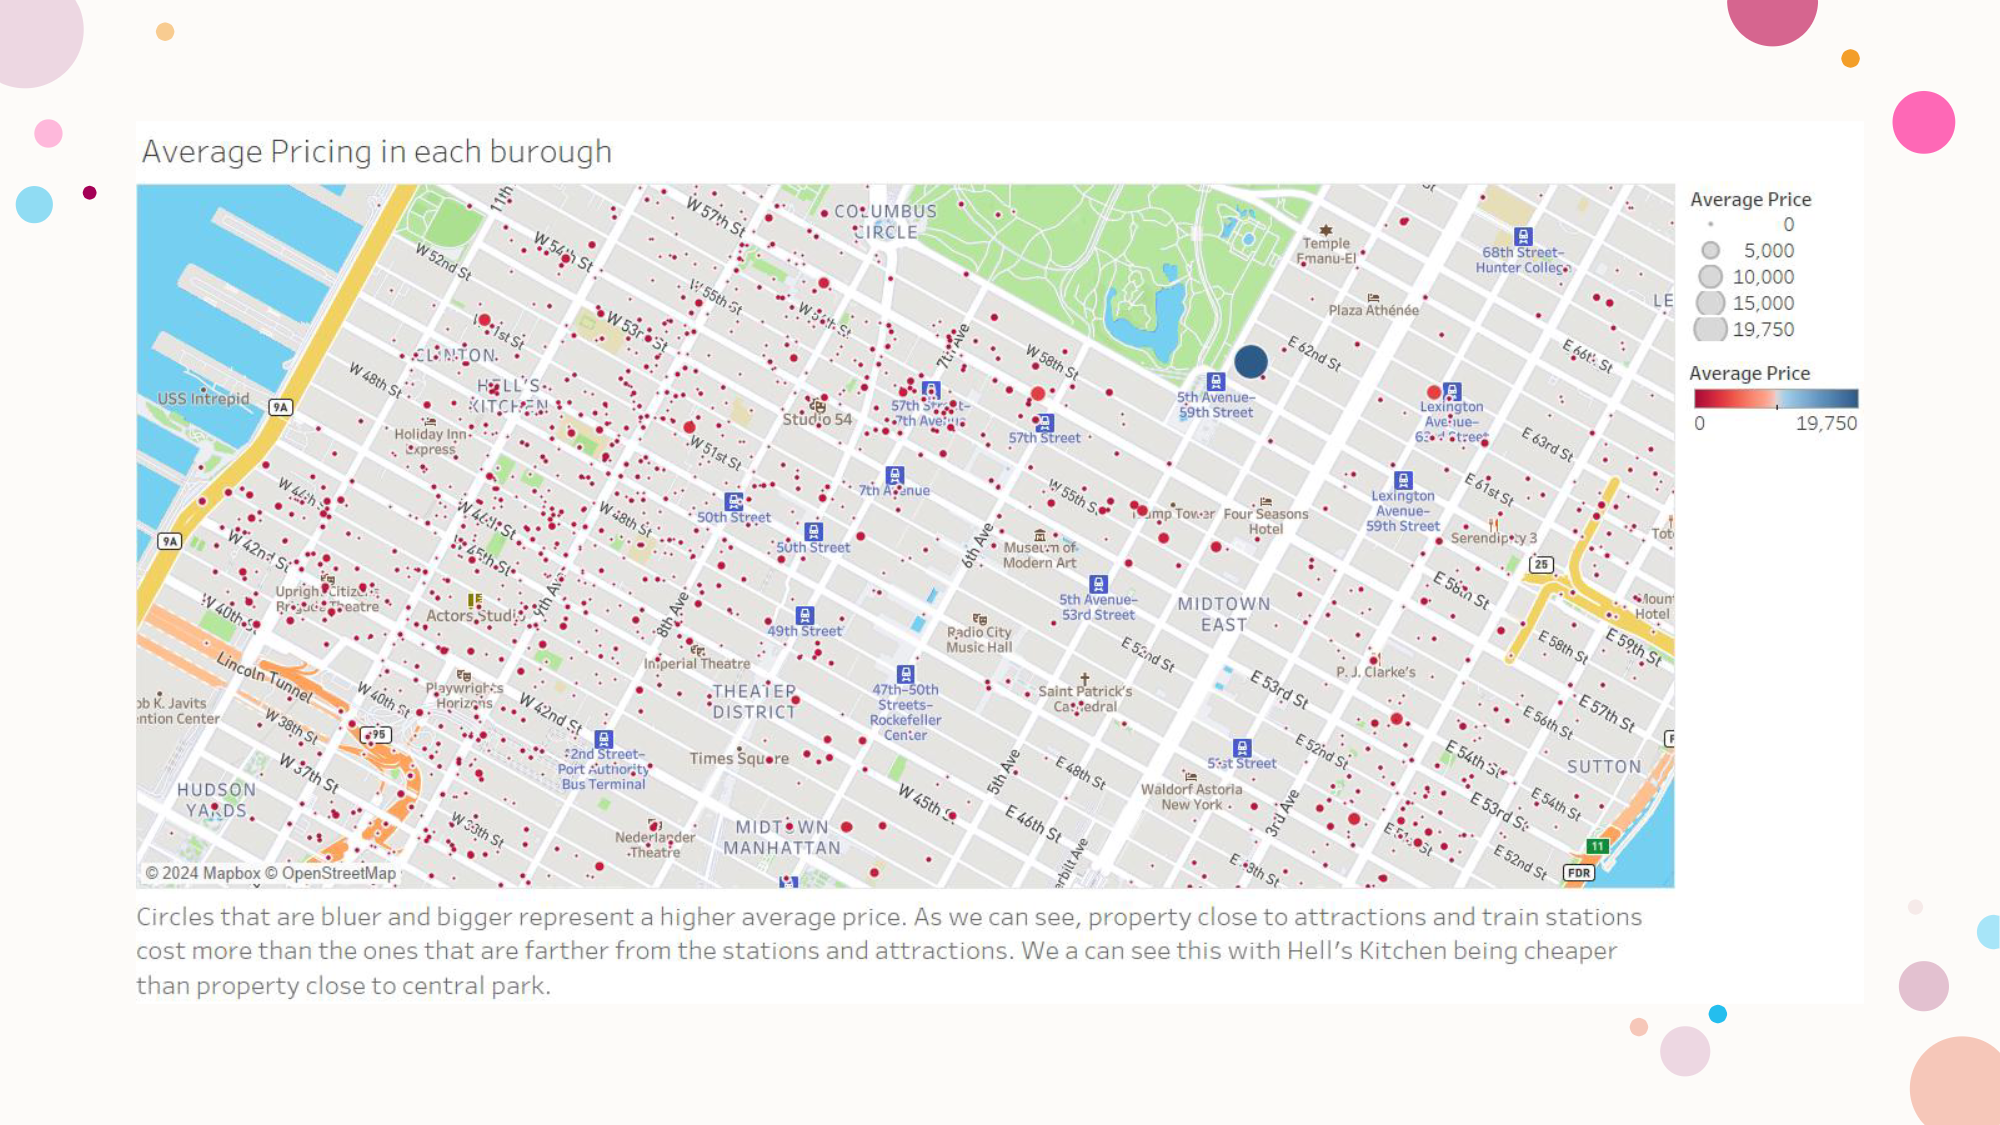
Spatial Price Distribution (Manhattan Focus)

Map of average rental prices in Manhattan. Properties closer to Central Park and key attractions trend higher, while areas like Hell’s Kitchen are relatively cheaper.

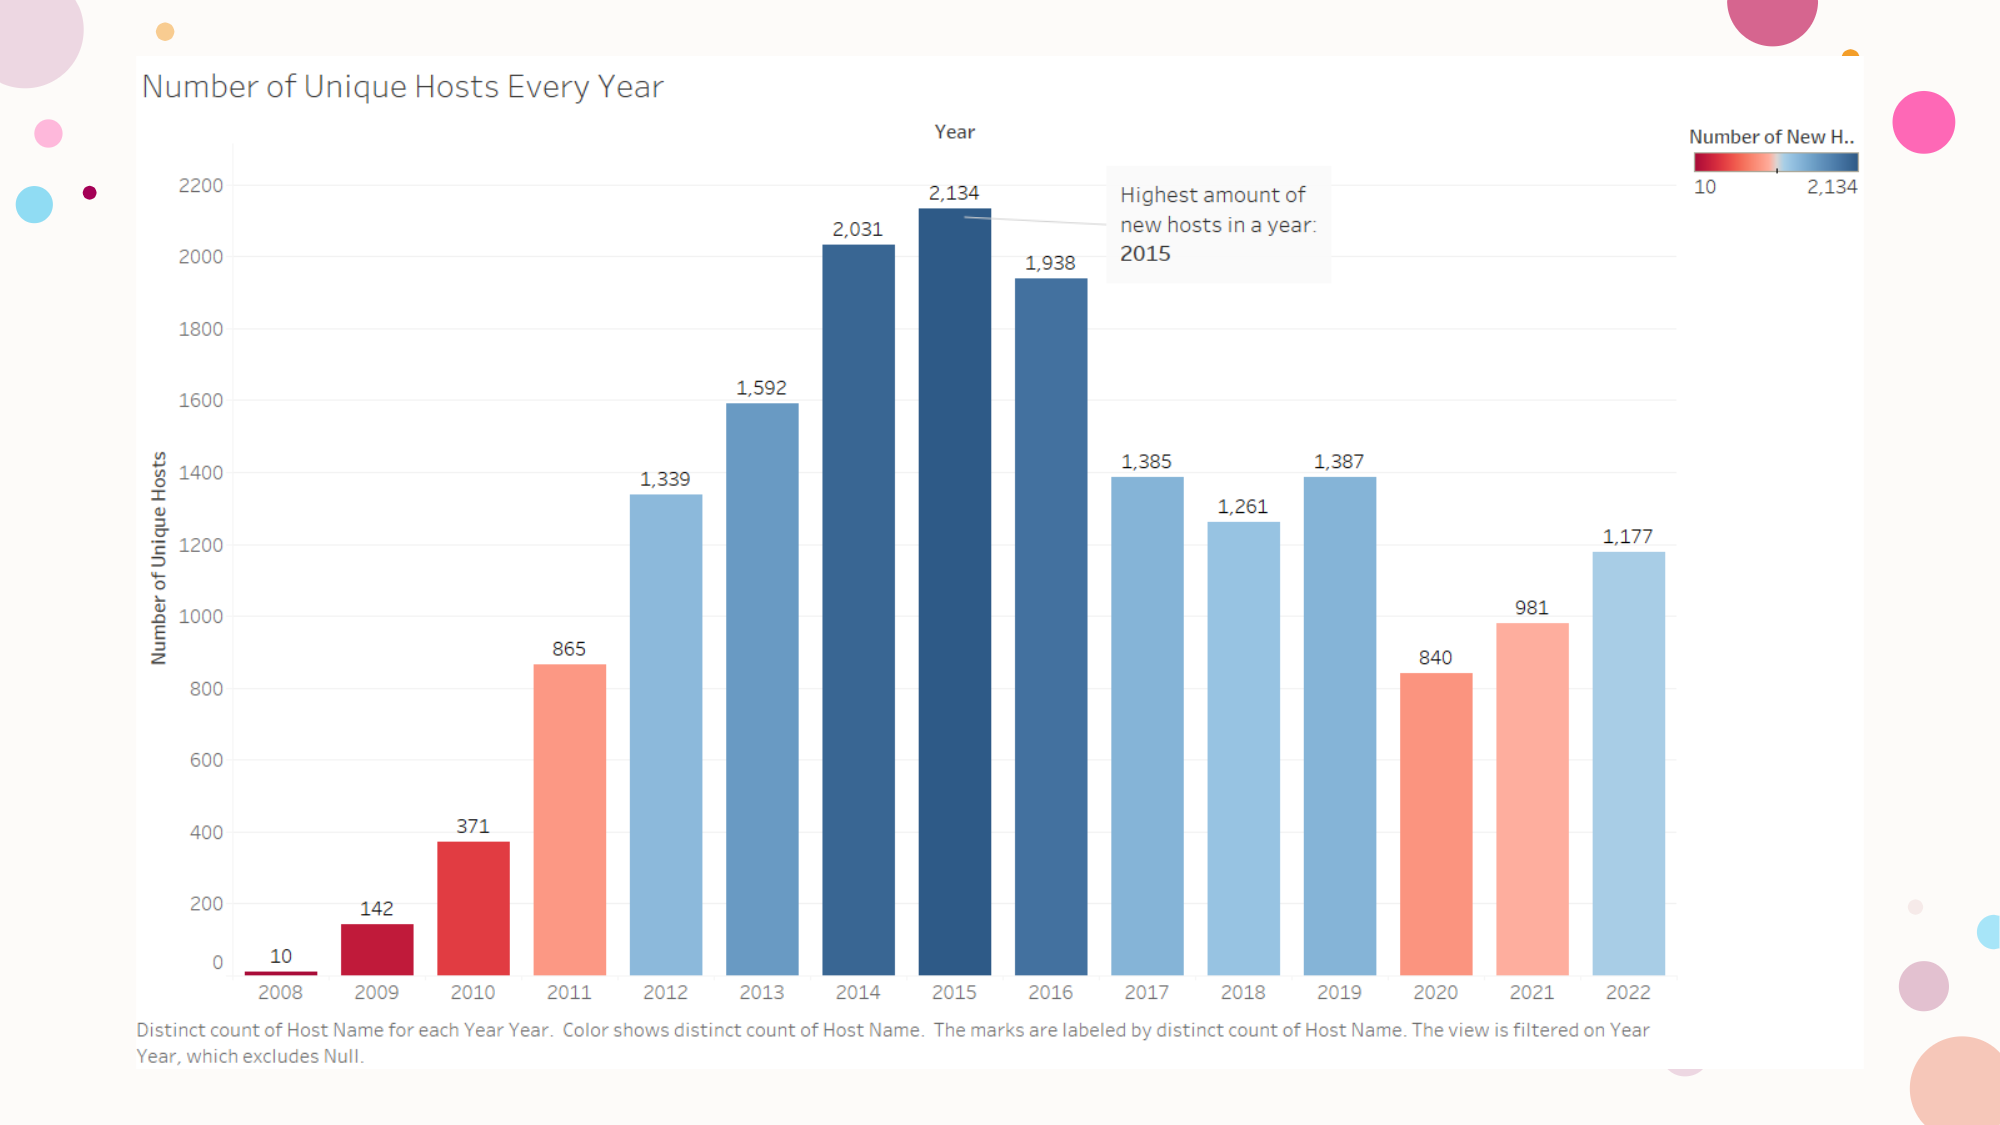
Growth of Unique Hosts Over Time

Number of new Airbnb hosts entering the NYC market each year. Peak host growth occurred in 2015, followed by a decline due to market saturation and regulation.

Repo / Live